How Madison Dividend Value ETF invests in quality and growth.
Authored by Drew Justman, Dividend Income & Covered Call Portfolio Manager
At the end of the first quarter, there were 20 stocks in the S&P 500 with dividend yields greater than 5.3% (or 4x the index). Of these 20 companies, 12 have a dividend payout ratio (dividend divided by net income) above 80%1. When such a high percentage of a company’s earnings goes to paying its dividend, any risks to revenue, earnings, and cash flow put that dividend in jeopardy. We think the economic and industry-specific uncertainty surrounding the Trump administration’s trade policies has increased risks to high dividend payout companies in recent months. For resiliency in difficult markets, we think investors should consider dividend growth and high quality characteristics over dividend yield alone.
Payout ratio, as mentioned above, is one metric we look at when assessing a company’s ability to continue to increase dividends into the future. We like to own stocks with payout ratios in the 30%-50% range. This sweet spot provides a cushion for when revenues, earnings, and cash flow are pressured, while allowing for future dividend growth to outpace inflation when these metrics recover.
For Madison’s Dividend Value ETF (NYSE: DIVL), we first screen for above-average dividend stocks that have a dividend yield at least 1.1x the S&P 500. We track this relative yield over time, and if a stock has a high dividend yield relative to its history, it may suggest the market is worried about the company’s near-term outlook or ability to continue paying its dividend. This could be an opportunity for us to invest. Next, we analyze a company’s business model, balance sheet, and cash flow profile to assess its ability to continue paying its dividend with the possibility of consistent dividend increases in the future. Ideally, a company would keep raising its dividend in line with earnings growth. We want to find stocks that have above-average dividend yields and potential dividend increases in the future, while avoiding stocks that may have high dividend yields but face secular challenges and limited ability to raise their dividends.
A recent earnings report from Dow Inc. (DOW) is a great example of a stock with a high payout ratio that raises questions about its dividend sustainability. In February of 2025, DOW issued a quarterly dividend of $0.70. A projected annual dividend yield of $2.80 is roughly a 7.8% dividend yield, more than 4.5x the market yield (S&P 500). However, if you look past the headlines and analyze the cash flow statements for the past year, all DOW’s free cash flow was used to pay the dividend. On a longer-term basis, DOW hasn’t generated earnings per share to cover the dividend. In 2023 and 2024, DOW had earnings per share of $0.82 and $1.57, respectively, compared to annual dividend payments per share of $2.80 both years. If companies are unable to earn their dividends consistently, we don’t view the dividends as sustainable sources of income, and we avoid investing in that company.
About Madison Dividend Value ETF
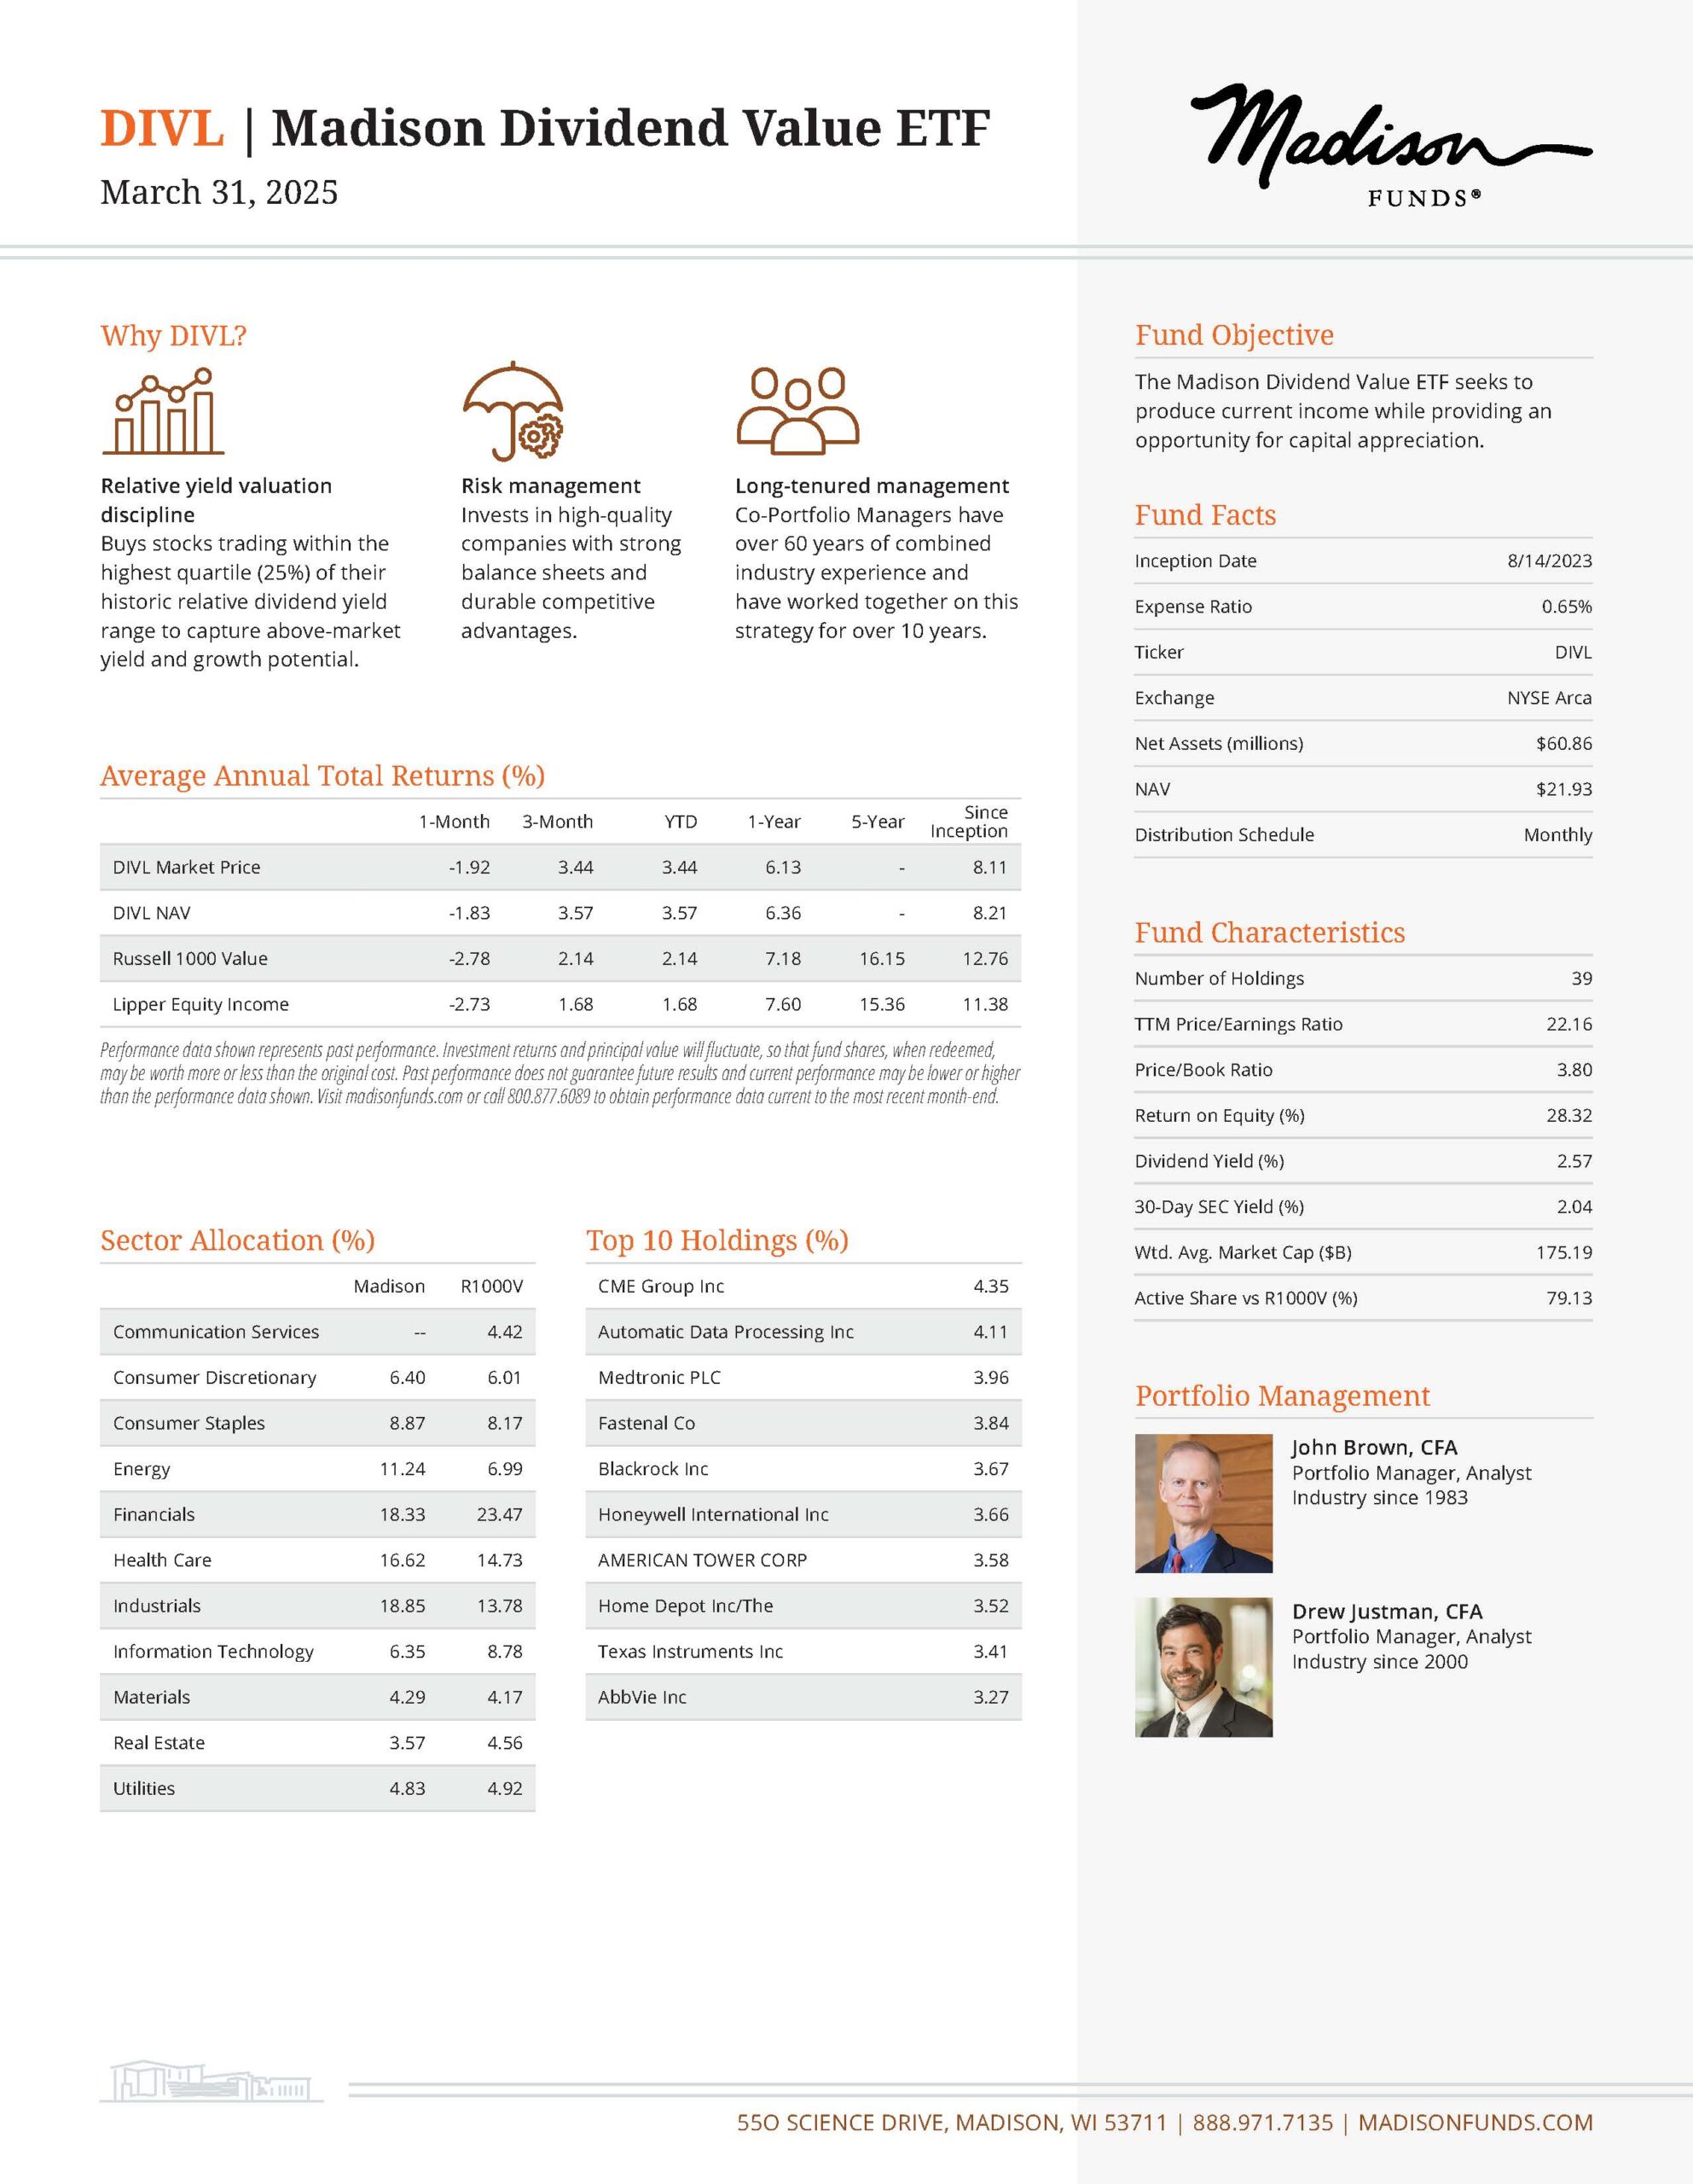
- High-conviction portfolio of 30-50 above-average dividend paying stocks.
- Over the past year, portfolio holdings have increased their dividends by nearly 8% on average1.
- High-quality portfolio reflected in strong balance sheets. Using Standard & Poor’s credit ratings to assess financial strength, 90% of fund holdings are rated A- or better1.
Disclosures
1 Data as of 3/31/2025
Consider the investment objectives, risks, and charges and expenses of Madison Funds carefully before investing. Each fund’s prospectus contains this and other information about the fund. Call 800.877.6089 or visit madisonfunds.com to obtain a prospectus and read it carefully before investing.
Madison Asset Management, LLC does not provide investment advice directly to shareholders of the Madison Funds.
Madison Funds are distributed by MFD Distributor, LLC, member of FINRA. Portfolio data is as of the date of this piece unless otherwise noted and holdings are subject to change.
“Madison” and/or “Madison Investments” is the unifying tradename of Madison Investment Holdings, Inc., Madison Asset Management, LLC (“MAM”), and Madison Investment Advisors, LLC (“MIA”). MAM and MIA are registered as investment advisers with the U.S. Securities and Exchange Commission. Madison Funds are distributed by MFD Distributor, LLC. MFD Distributor, LLC is registered with the U.S. Securities and Exchange Commission as a broker-dealer and is a member firm of the Financial Industry Regulatory Authority. The home office for each firm listed above is 550 Science Drive, Madison, WI 53711. Madison’s toll-free number is 800-767-0300.
Any performance data shown represents past performance. Past performance is no guarantee of future results.
Non-deposit investment products are not federally insured, involve investment risk, may lose value and are not obligations of, or guaranteed by, any financial institution. Investment returns and principal value will fluctuate.
This report is for informational purposes only and is not intended as an offer or solicitation with respect to the purchase or sale of any security and is not investment advice.
An investment in the Fund is subject to risk and there can be no assurance the Fund will achieve its investment objective. The risks associated with an investment in the Fund can increase during times of significant market volatility. The principal risks of investing in the Fund include equity risk, capital gain realization risks to taxpaying shareholders, growth and value risks, special risks associated with dividend paying stocks, foreign security and emerging market risk, depository receipt risk, interest rate risk, and market risk. More detailed information regarding these risks can be found in the Fund’s prospectus.
Indices are unmanaged. An investor cannot invest directly in an index. They are shown for illustrative purposes only, and do not represent the performance of any specific investment. Index returns do not include any expenses, fees or sales charges, which would lower performance.
The S&P 500® Index is a large-cap market index which measures the performance of a representative sample of 500 leading companies in leading industries in the U.S.
The Russell 1000® Index measures the performance of the 1,000 largest companies in the Russell 3000® Index, which represents approximately 89% of the total market capitalization of the Russell 3000 Index.
Dividend yield of the portfolio is a weighted average of the underlying fund holdings and not the yield of the fund.
Upon request, Madison may furnish to the client or institution a list of all security recommendations made within the past year.

