Somewhere in the dust of the speculative AI-hype-driven equity market advance this year, dividend payers have been left for dead. Among these laggards are high-quality, growing businesses with strong balance sheets and a history of paying (and increasing) dividends. For portfolio managers John Brown and Drew Justman, one valuation metric is signaling a potential buying opportunity not seen in decades.
First, let’s examine how we got here. Following a strong recovery from the COVID shock in 2020-2021, 2022 will be remembered as the year that interest rates and inflation ruined the party. Both equities and bonds saw sizable losses. In this environment, high-quality, dividend-paying stocks helped protect against the overall market downside.
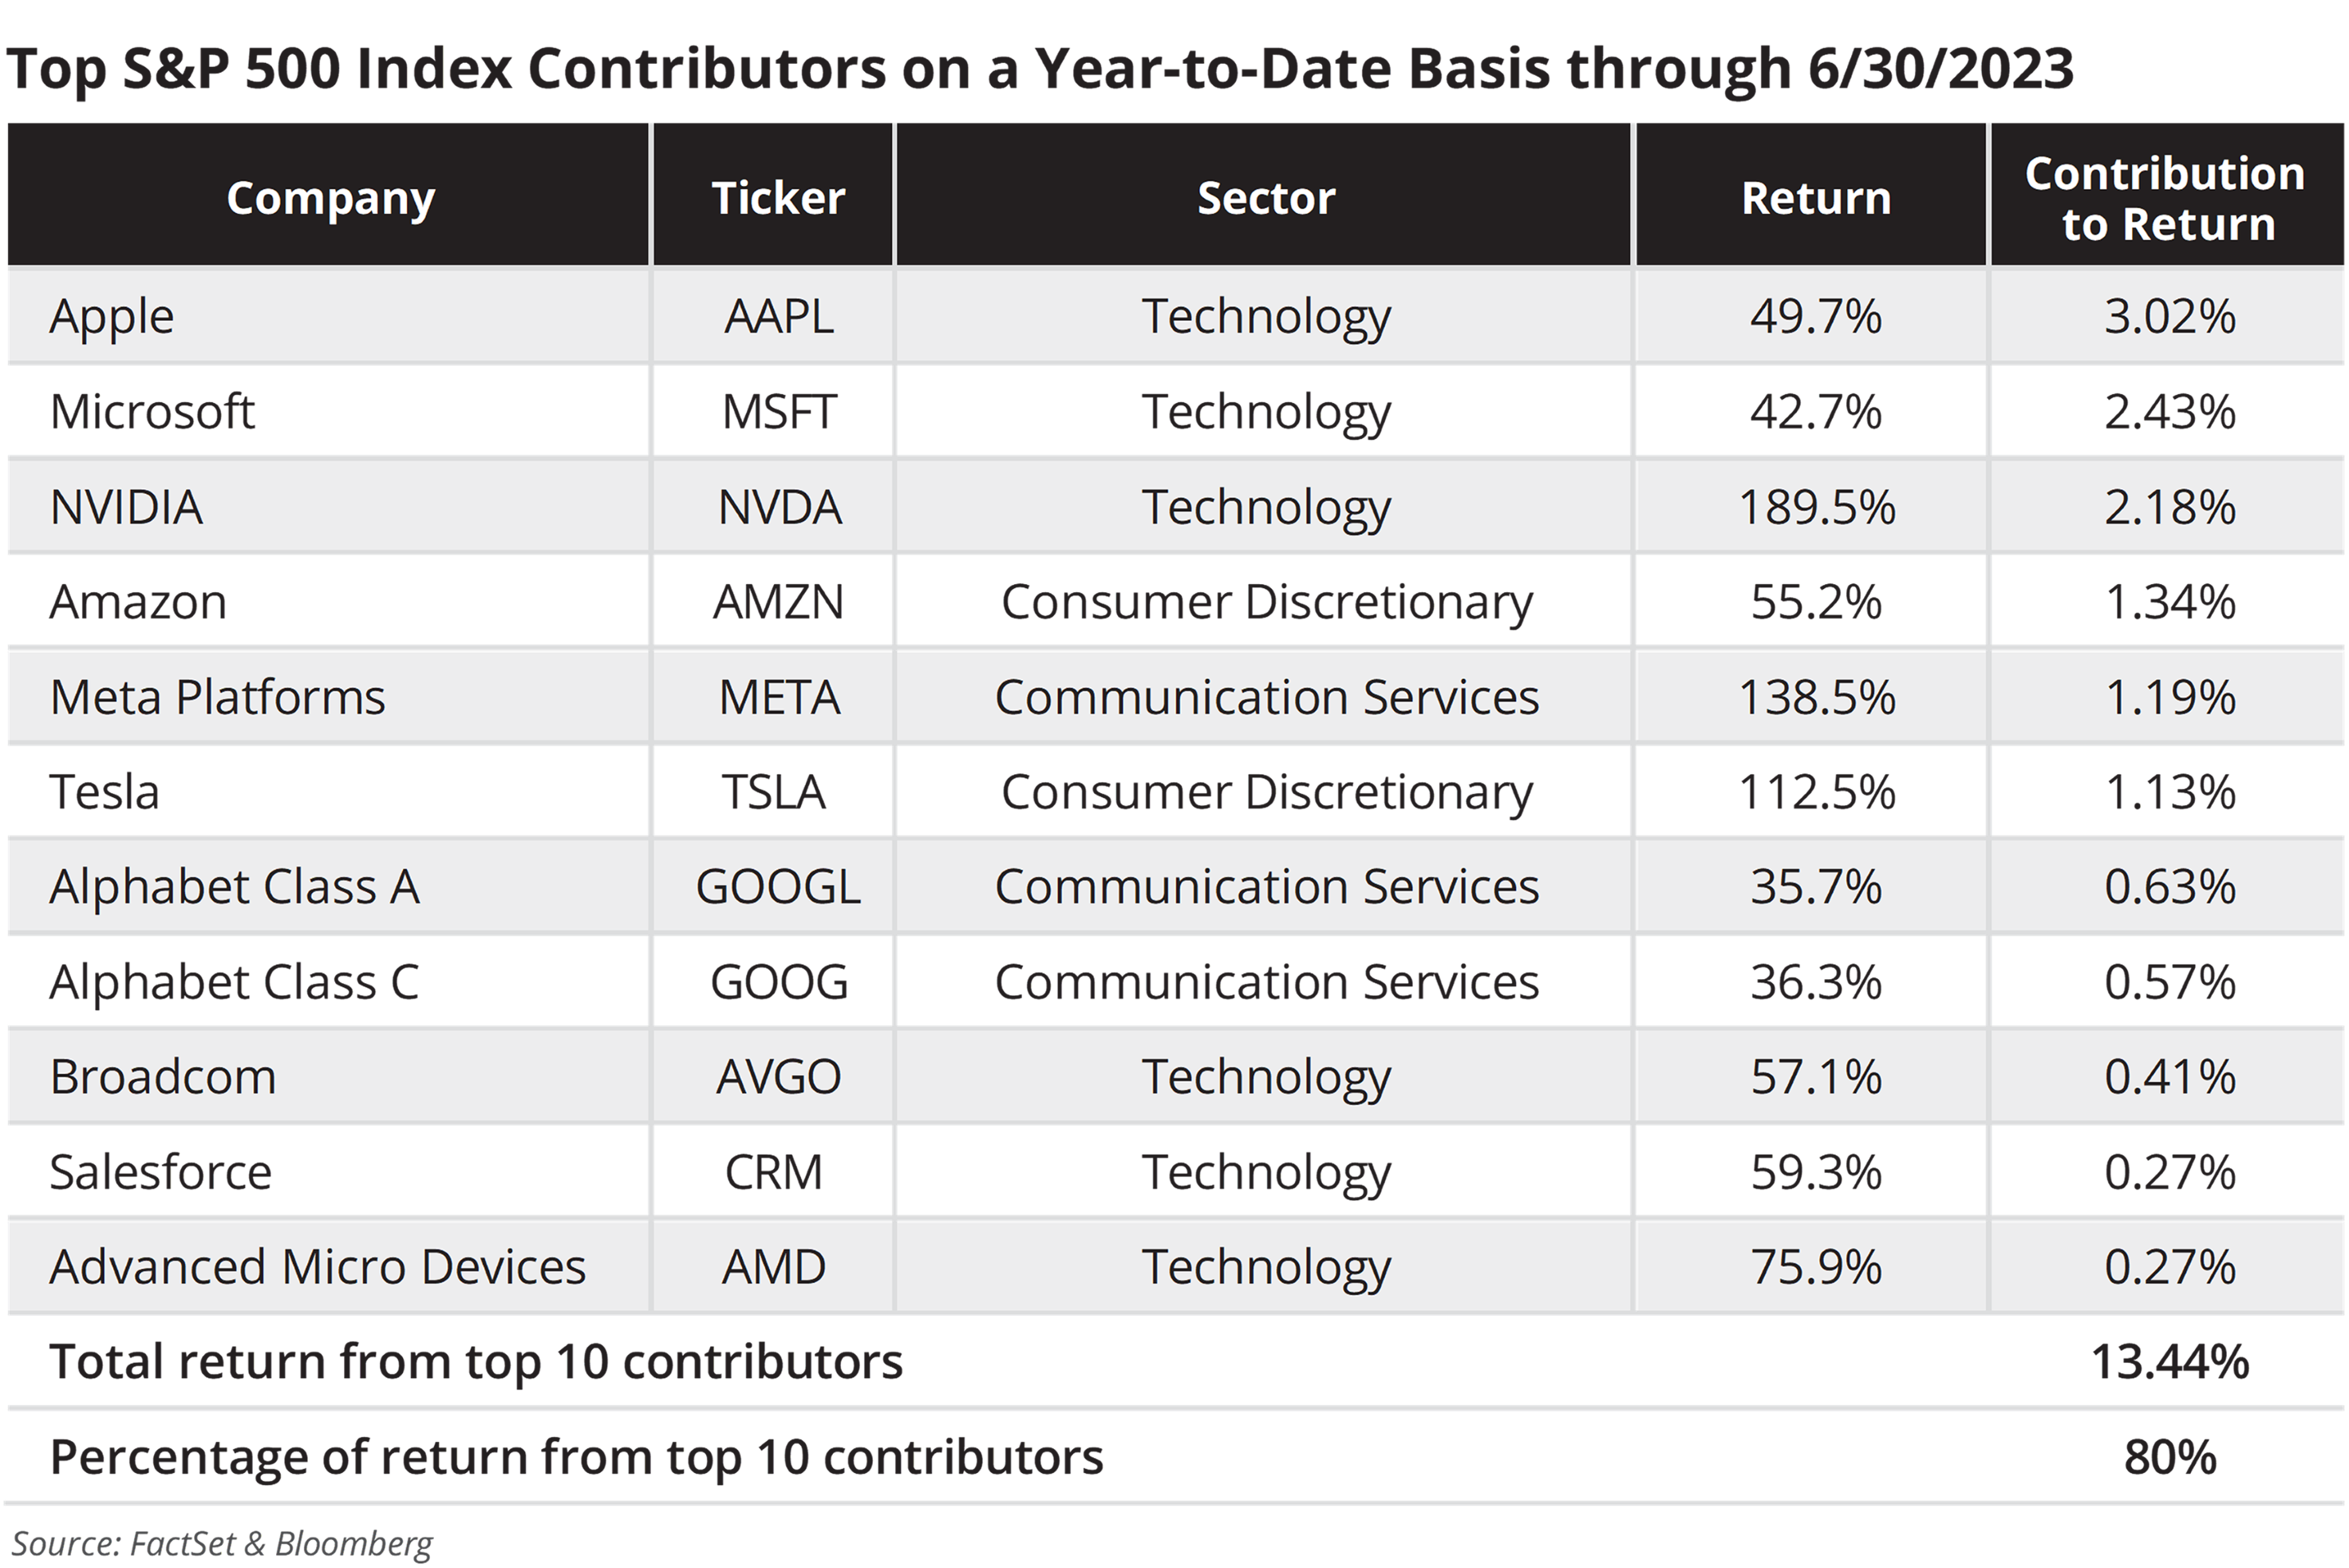
From about mid-October 2022 through the end of the second quarter of 2023, the equity market was engrossed by two dominant themes: leadership by a narrow group of growth stocks – see the top contributors table – and the significant underperformance of dividend-paying stocks. A recent Wall Street Journal headline summarized these dynamics well: “Investors Spurn Dividend-Paying Stocks as AI Booms.”
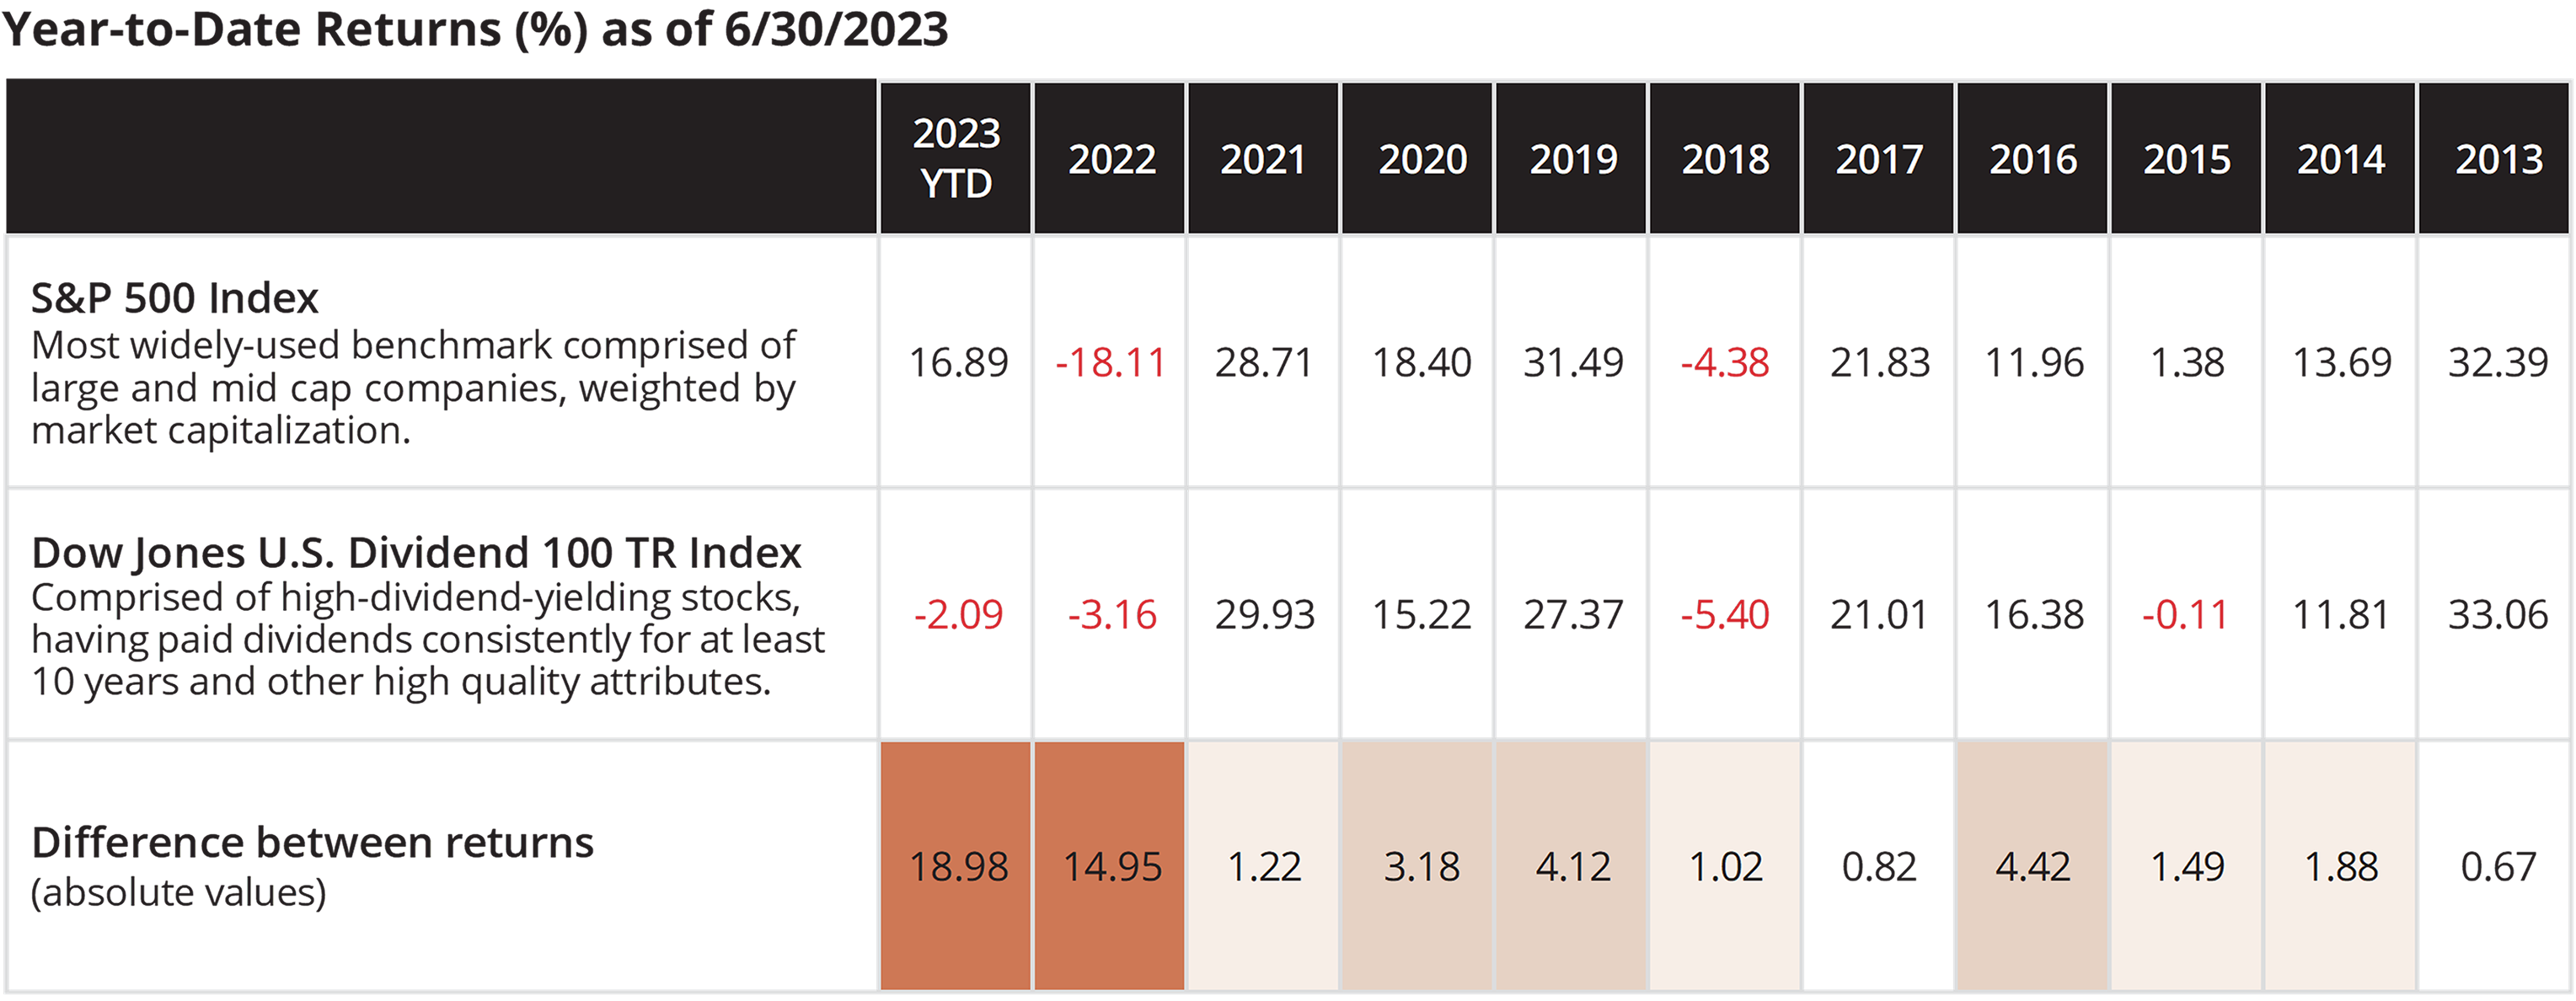
Through the first half of 2023, two representative dividend stock indices, the Dow Jones U.S. Dividend 100 Total Return Index and the Dow Jones Dividend Select Index were down -2.1% and -4.3%, respectively, and many high-quality, above-average dividend-paying stocks experienced negative returns during the period.

Highlights:
- The top 10 individual contributors were limited to three sectors: Technology, Communications Services, and Consumer Discretionary.
- The top 10 stocks contributed 80% of the total return of the S&P 500.
- The equal-weight S&P 500 return was just 7%.

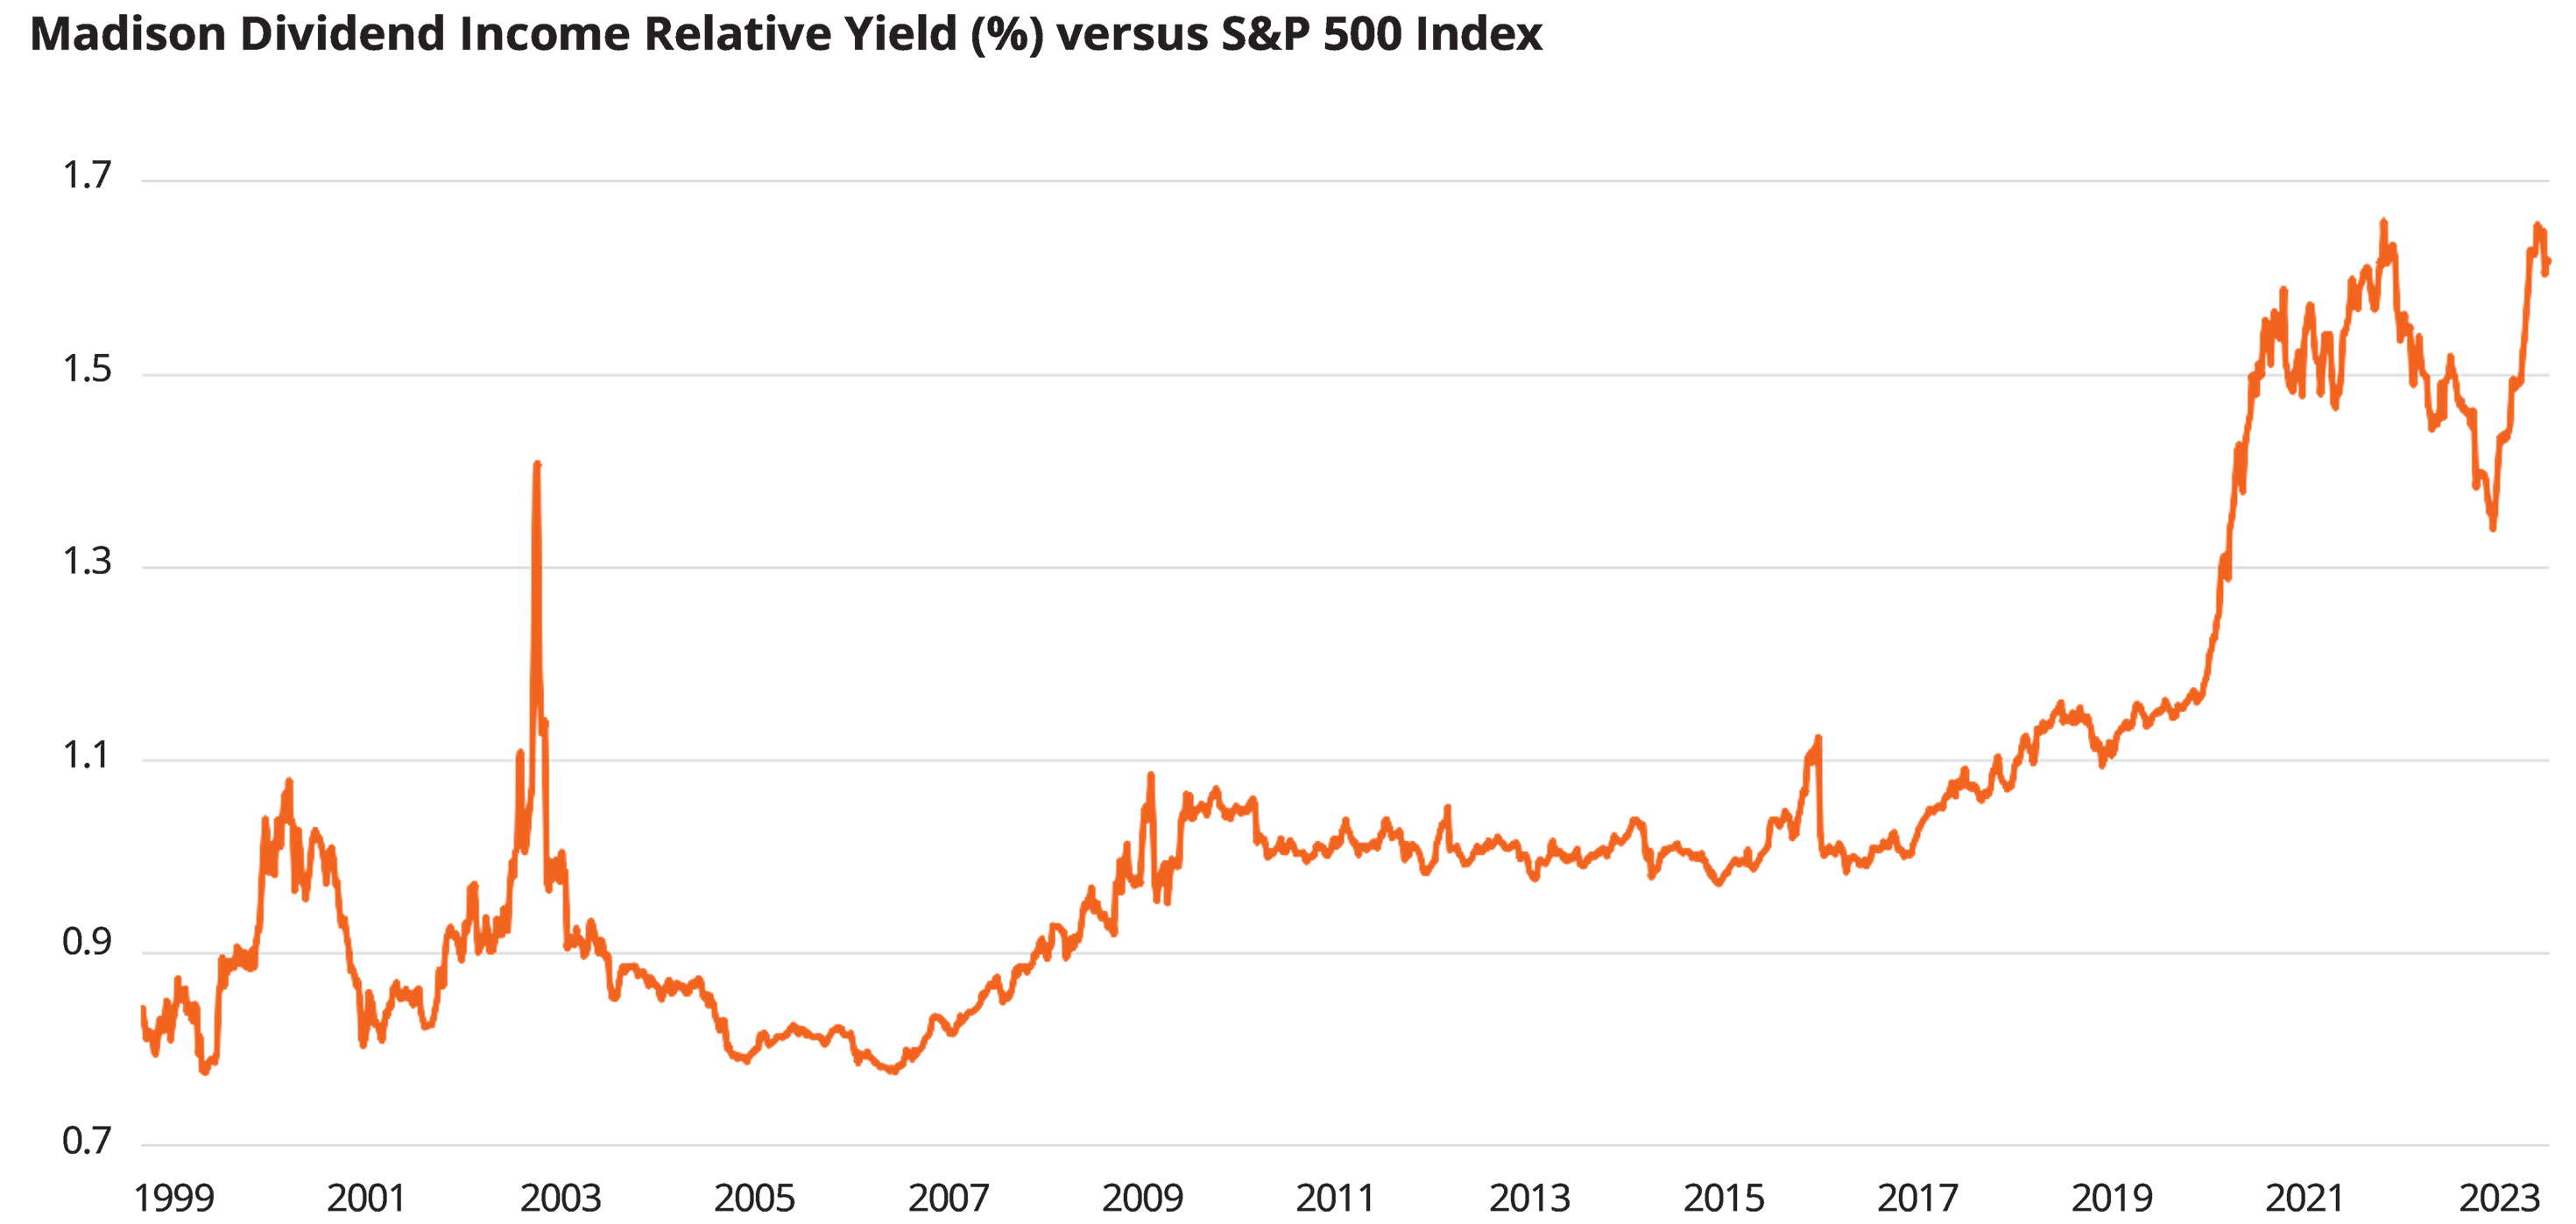
But there is reason to be optimistic. While the overall market valuation, using the price-to-earnings multiple is above its historical average, another valuation metric (for dividend stocks) tells a different story. Looking at relative yield – the primary valuation metric that Madison’s Dividend Income team relies upon in their analysis – many high-quality dividend stocks are trading at historically attractive levels.
Portfolio Managers John Brown and Drew Justman use relative yield as a starting point for equity valuation because, as an income-generating portfolio, using a dividend-centric methodology provides a baseline measurement against the broad market (in this case, the S&P 500) and can also track the trend of an individual stock. By looking at a company’s relative yield over time, the team can better assess the stock’s margin of safety – and its capacity to grow.
Relative yield is defined as a stock’s dividend yield divided by the overall market’s dividend yield. Considering the equation for dividend yield (dividend ÷ price), relative yield increases when a stock’s price declines, its dividend rises, the market dividend yield average shrinks, or any combination of the three. When relative yield for a stock is high versus history, the stock may be undervalued and therefore priced attractively. This could result from issues the market deems unfavorable to the company’s prospects. If the issues are believed to be overstated by the market or temporary, it may be a candidate for investment. John and Drew rely on extensive fundamental analysis to make that determination. On the other hand, if a stock’s relative yield is on the low end of its historical average, the stock may be overvalued.
Rare Opportunity to “Buy High” in Dividend Stocks
One of the consequences of the underperformance of dividend-paying stocks coupled with the outperformance of non-dividend paying stocks is that the Relative Yield for many dividend stocks has drifted higher. Among the 41 holdings in the Madison Dividend Income Fund, the relative yield of 40 holdings is above their 20-year average.

Relative Yield in the Madison Dividend Income Fund as of 6/30/2023
- 12 out of 41 portfolio holdings had relative yields more than 200% of their 20-year average
- 9 out of 41 portfolio holdings had registered all-time high relative yields this year
- The average portfolio holding is 71% above its 20-year relative yield average
If you believe that the current market rally will broaden out and dividend stock valuations will revert to historical averages, this could prove to be a rare opportunity to invest in high-quality, above-average dividend stocks at below-average valuations.
Disclosures
Performance data shown represents past performance. Investment returns and principal value will fluctuate, so that fund shares, when redeemed, may be worth more or less than the original cost. Past performance does not guarantee future results and current performance may be lower or higher than the performance data shown. Visit madisonfunds.com or call 800.877.6089 to obtain performance data current to the most recent month-end.
An investment in the fund is subject to risk and there can be no assurance the fund will achieve its investment objective. The risks associated with an investment in the fund can increase during times of significant market volatility. The principal risks of investing in the fund include: equity risk, growth and value investing risk, special risks associated with dividend paying stocks, option risk, interest rate risk, capital gain realization risks to taxpaying shareholders, and foreign security and emerging market risk. More detailed information regarding these risks can be found in the fund’s prospectus.
Indices are unmanaged. An investor cannot invest directly in an index. They are shown for illustrative purposes only, and do not represent the performance of any specific investment. Index returns do not include any expenses, fees or sales charges, which would lower performance.
The Dow Jones U.S. Select Dividend Index aims to measure the performance of high dividend-paying U.S. stocks, excluding REITs, meeting specific criteria for dividends, earnings, size and liquidity. It uses a yield-driven weighting method.
Non-deposit investment products are not federally insured, involve investment risk, may lose value and are not obligations of, or guaranteed by, any financial institution. Investment returns and principal value will fluctuate.
This report is for informational purposes only and is not intended as an offer or solicitation with respect to the purchase or sale of any security.