
Dividends can be an added benefit when investing in stocks. However, simply because a stock has a high dividend yield doesn’t necessarily make it a solid investment or a good addition to a portfolio. We believe a good dividend yield is only part of the reason to invest in a particular stock. In managing Madison’s Dividend Income Fund, we look beyond a stock’s absolute dividend yield to invest in high-quality companies that we feel will be able to sustain and grow their dividend into the future. With the stock’s historical relative yield as the valuation guide, we believe our approach offers the right balance between above-market dividend yield and strong overall fundamentals.
1
The first step in our process is to identify stocks with above-average dividend yields at least 1.1x (10% greater than) the average S&P 500 dividend yield.
2
Next, we apply our Relative Yield process to assess the stock’s valuation and take emotion out of the investment decision-making process. This process will be explained in detail later in the article.
3
Then, we perform a bottom-up fundamental analysis of the stocks that pass our Relative Yield screen. A stock’s price is usually low for a reason. Our job is to dig deeper to understand the why.
4
Finally, guided by both our relative yield process and extensive fundamental analysis, we build a diversified portfolio of our 35-50 highest conviction stocks. These are the stocks that we believe to be of the highest quality with above-average dividend yields.
What is relative yield?
Relative yield is a stock’s dividend yield relative to the market’s overall dividend yield. In our process and in referencing the “market” in this article, we will use the S&P 500 Index. A stock’s dividend yield by itself doesn’t tell us much about the stock as it is simply a number at a given point in time. Instead, we look at the stock’s yield in context to analyze if the relative yield is a positive or negative indicator.
Relative yield is calculated as:
Stock’s dividend yield (dividend/price) ÷ Market Yield (dividend/price)
What’s important to analyze, and a key focus of our Dividend Income team, is the stock’s historical relative yield. We look at the historical pattern of the stock’s relative yield to determine if its current valuation is attractive.
- A high relative yield compared to the stock’s historical range indicates a level of pessimism about the stock built into its share price.
- A low relative yield compared to the stock’s historical range often indicates the stock is “expensive”
- A historically high relative yield can indicate a good time to purchase shares at the stock’s depressed price.
Relative Yield History = (Stock’s dividend yield ÷ Market Yield Range) > Normal Historical
We will only initiate an investment in stock if its dividend yield is 1.1x (or 10% higher) than the S&P 500 Index dividend yield. We then analyze the stock’s relative yield trend to dictate when to invest.
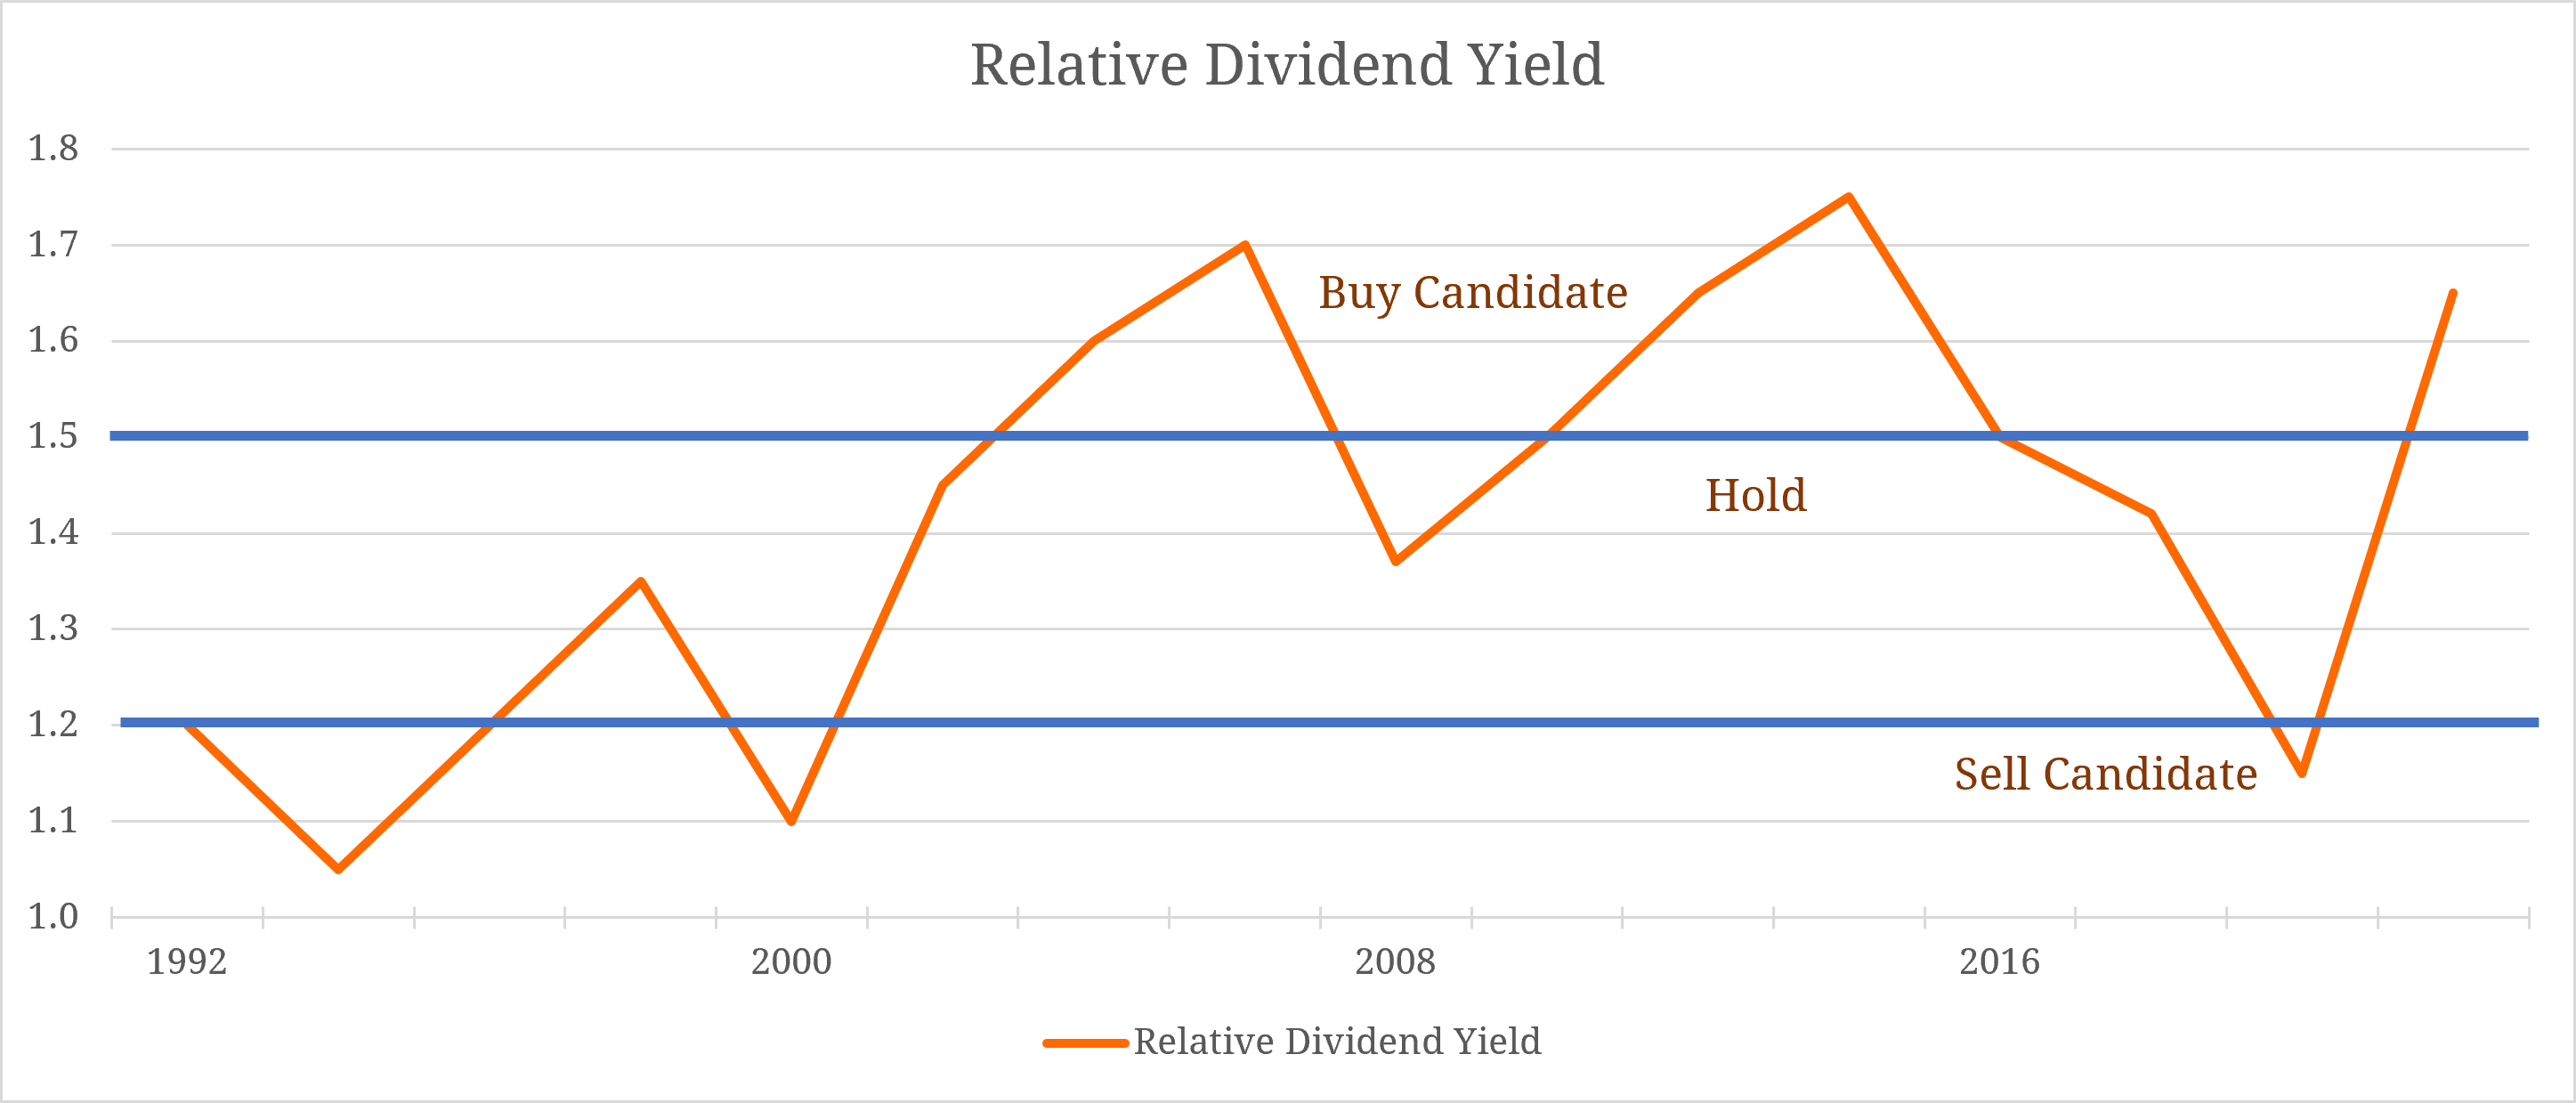
While these valuation levels are a guide, we have found that using these buy, sell, and hold parameters for stocks based on their relative yield to the market as a whole has served our fund shareholders well over time.
Digging deeper
Historical trends for the relative yield of a stock compared to the market can help to highlight stocks whose pricing might be attractive to add to a portfolio. But this is just the first step in our process.
We then dig into why the stock’s relative yield is high. Is this a temporary situation or a permanent condition? Turning to fundamental analysis, we dig deeper into the company’s financials, management, and business environment.
- Is the issue or issues causing the stock’s price to be depressed temporarily or terminally?
- Is the company’s balance sheet solid?
- Has the company’s dividend (and dividend growth) remained consistent throughout history?
If the causes of the depressed stock price arise from issues that we believe are temporary, we continue to analyze the stock. Temporary issues can be the result of general economic conditions impacting demand for the company’s product or services. It could also be something like temporary internal production or distribution issues.
If the issue depressing the stock’s price is terminal, we generally avoid the stock. A terminal issue could be regulatory problems that threaten to put the company out of business, or perhaps the company has run into terminal financial problems.
If our team believes the issues are temporary the next step is to evaluate the company’s balance sheet. If the balance sheet is weak, this is often indicative of problems to come. Revenue and earnings are important, but a weak balance sheet can be tough to overcome.
Just as with a terminal problem that is causing the stock’s price to be depressed, we will avoid buying a company with a weak, distressed balance sheet.
The combination of a stock with a high relative yield due to temporary issues and a strong balance sheet can offer a strong buy indicator. Our sweet spot is when a stock is trading at the high end of its historical relative yield range.
This is the ultimate win-win situation. Our fund shareholders receive a strong dividend yield while we wait for the stock price to hopefully appreciate.
Ongoing monitoring
Determining when and if to buy a stock based on its relative yield is only the first step in the ongoing process. Our team monitors the stock’s relative yield on an ongoing basis. When the relative yield gets too low relative to historical ranges, this could be time to sell. This discipline helps us remove emotion from the investment process and maintain a portfolio of high-quality, above-average dividend-paying companies.
Quality matters
The Madison Dividend Income team employs a fundamental research approach that emphasizes companies with:
- A sustainable competitive advantage in their industry or sector. In other words, we look for companies with a wide moat.
- A strong balance sheet. We look for companies with the ability to continue to pay dividends. Ideally, they have a credit rating from S&P of A- or better.
- A history of consistent dividend increases. This is a sign of financial strength and of a strong management team.
If this type of quality-driven dividend-focused approach appeals to you or your clients, take a look at the Madison Dividend Income Fund.
Disclosures
An investment in the fund is subject to risk and there can be no assurance the fund will achieve its investment objective. The risks associated with an investment in the fund can increase during times of significant market volatility. The principal risks of investing in the fund include: equity risk, growth and value investing risk, special risks associated with dividend paying stocks, option risk, interest rate risk, capital gain realization risks to taxpaying shareholders, and foreign security and emerging market risk. More detailed information regarding these risks can be found in the fund’s prospectus.
This report is for informational purposes only and is not intended as an offer or solicitation with respect to the purchase or sale of any security.
Although the information in this report has been obtained from sources that the firm believes to be reliable, we do not guarantee its accuracy, and any such information may be incomplete or condensed. All opinions included in this report constitute the firm’s judgment as of the date of this report and are subject to change without notice. This report is for informational purposes only and is not intended as an offer or solicitation with respect to the purchase or sale of any security.
Upon request, Madison may furnish to the client or institution a list of all security recommendations made within the past year.
Diversification does not assure a profit or protect against loss in a declining market.